
A) Usage Query
- The system supports multi-dimensional query and monitoring of CDN operational status through core metrics including traffic, cache hit ratio, QPS, status codes and origin retrieval statistics, enabling comprehensive and intuitive service health assessment:
- Traffic: Displays total traffic, upstream and downstream traffic with granular breakdowns by domain, time period, helping identify traffic peaks and fluctuations.
- Cache Hit Ratio: Tracks cache hit rate to evaluate caching strategy effectiveness. Low hit ratios can guide optimizations for TTL settings and cache key rules.
- QPS: Provides real-time and time-series request statistics to reflect peak and steady traffic pressure, supporting capacity evaluation and expansion prediction.
- Status Codes: Differentiates 2xx, 4xx, 5xx and other response codes to quickly locate client errors, origin server exceptions and permission issues.
- Origin Retrieval Metrics: Monitors origin traffic, origin QPS, retrieval latency and failure codes to troubleshoot origin server pressure, timeout errors and service unavailability.
- Supports custom time ranges (minute/hour/day dimension), multi-dimensional filtering by domain, ISP and country, data export, and API integration for automated monitoring and alerting.
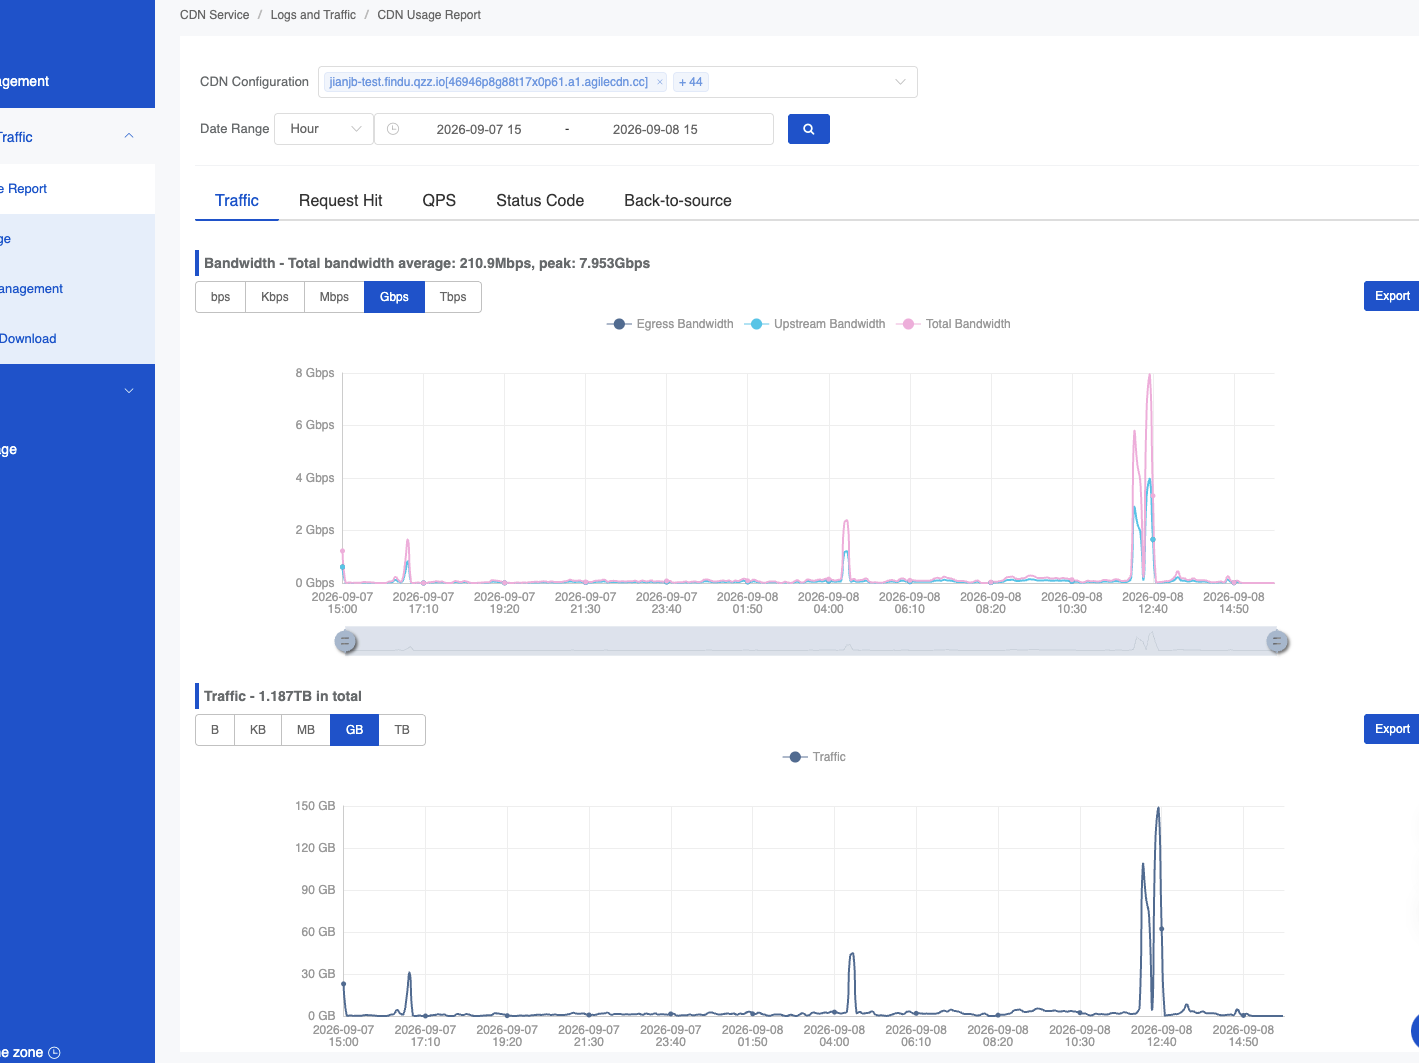
But I want to remind you that the time here is usually UTC time.
B)Logs
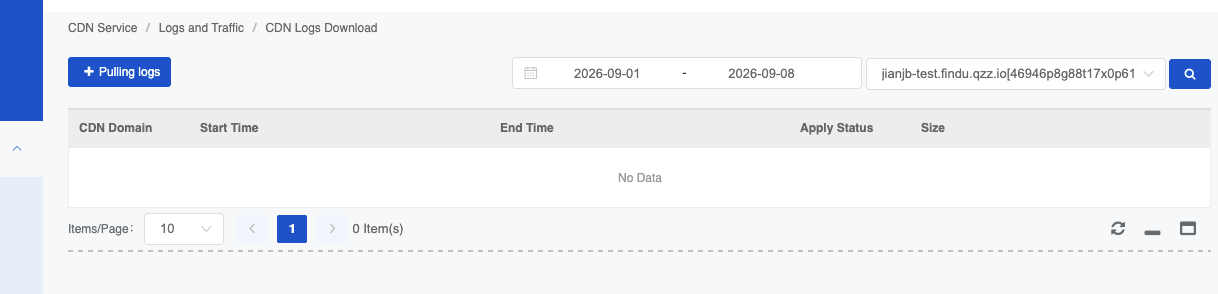
Besides,we provide logs query service, It may take a while to query the specified date for the first time, please wait patiently. So next time when you query the same specified date, the result will be show at once.